How 9Ware Generated the AUDL Net SPI Rankings
[See Rankings Here]
The purpose of this project was to establish the first ever Statistical Power Index (SPI) ranking for all teams in the history of the American Ultimate Disc League (the AUDL). This was accomplished by compiling and analyzing final-score results from every AUDL game ever played. In all, 1284 games have been played since the league launched in 2012.
It is important to note that this project was about determining an Historical Ranking, where we've treated every game equally rather than putting more weight on recent games and seasons. This differs significantly from other power rankings in sports, which use either statistical or subjective analysis to determine team rankings based on current form (but we may do that next!).
Validate Gaussian Approximations for Historical Score Distributions
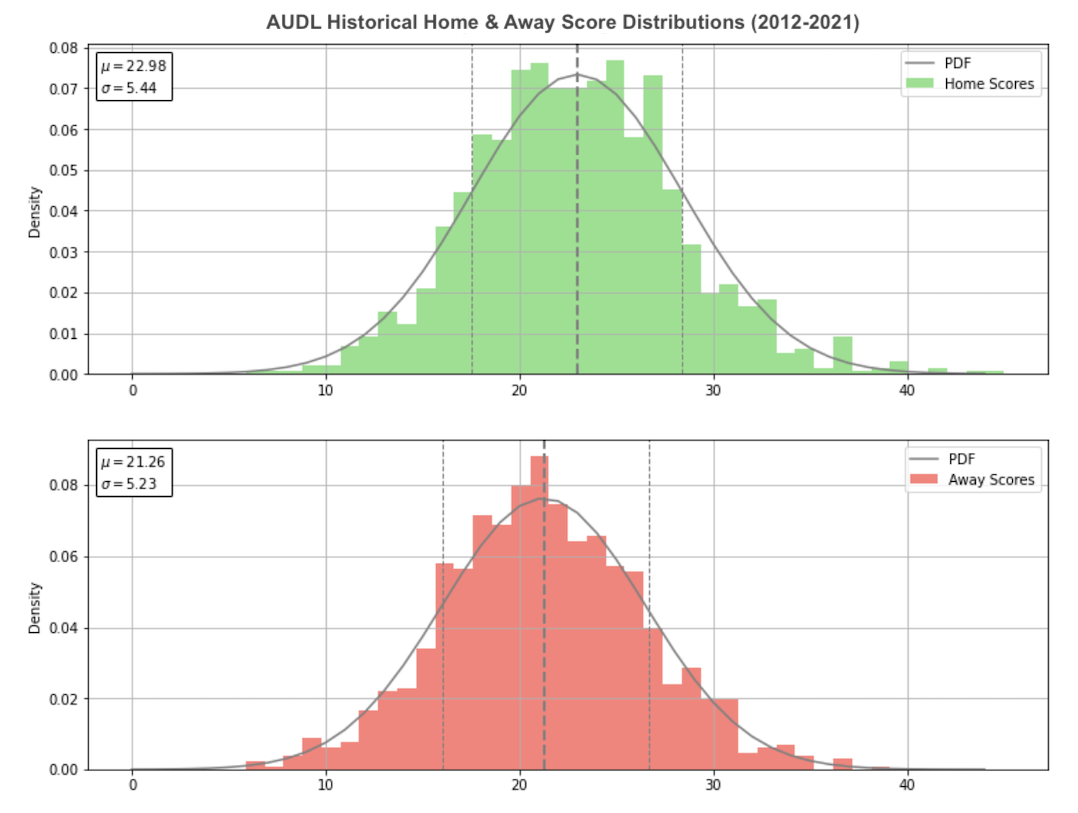
We doubled up all postseason games to make them twice as important as regular season games, and then we determined the statistical pattern of the "Average AUDL Home Team" and "Average AUDL Away Team" and inspected those results to confirm that it's reasonable to use a Gaussian/normal approximation for these distributions. In other words,
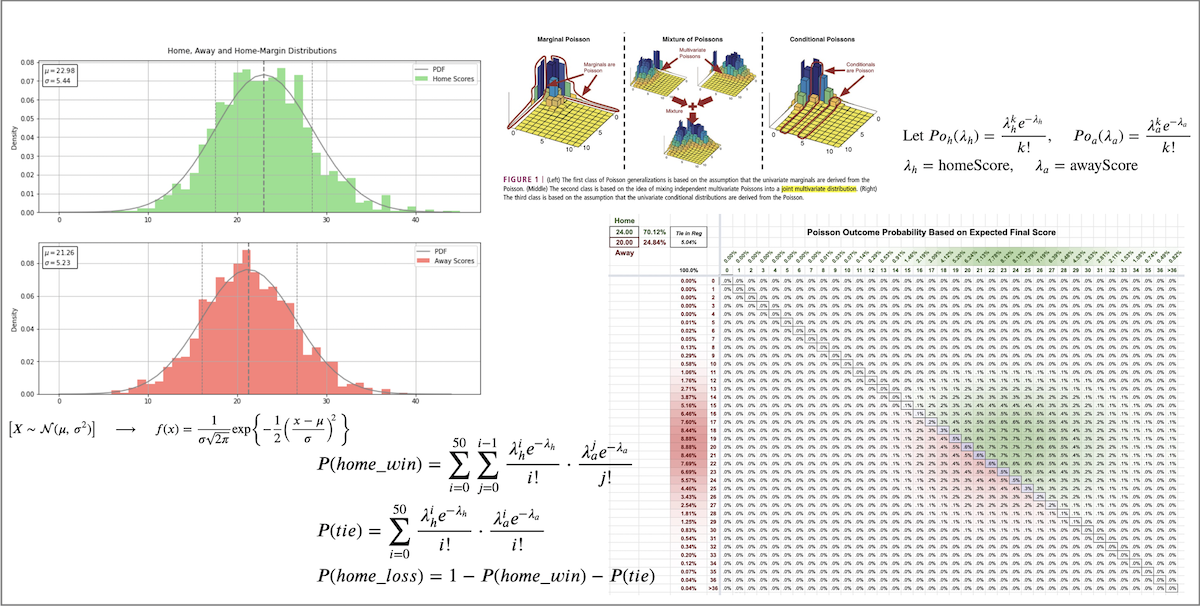
$$\left[X \sim \mathcal{N}(\mu,\,\sigma^{2})\right] \quad \longrightarrow \quad f(x) = \frac{1}{\sigma\sqrt{2\pi}} \exp\left\{-\frac{1}{2}\left(\frac{x-\mu}{\sigma}\right)^{\!2}\,\right\}$$where the mean $\mu$ and standard deviation $\sigma$ are determined by the spread of final scores in each data set. This is a fairly common and straightforward statistical approach to approximate a data set as long as the data itself, in histogram form, compares favorably to the approximation.
And it turns out that yes, the "Average" home and away teams' scoring results across all 1284 matches closely resemble normal distributions...
Simulate Games Using Monte Carlo Method & Poisson Probability Distribution
We then proceeded to generate the same approximation for each team individually based on its own historical home and away results, and performed 10000-game Monte Carlo simulations for each team vs the Average AUDL teams (5000 home and 5000 away).
At this point, the typical approach for each simulated game would be to randomly select a number from each competing normal (gaussian) distribution and determine a win or loss. But we took our analysis one step further by feeding each of the sample 'final scores' into a bivariate Poisson distribution analysis. Here's how we set up the Poisson:
$$\begin{aligned} &\text{Let } Po_h(\lambda_h) = \frac{\lambda_h^k e^{-\lambda_h}}{k!}, \quad Po_a(\lambda_a) = \frac{\lambda_a^k e^{-\lambda_a}}{k!} \\ &\lambda_h= \text{homeScore}, \quad \lambda_a= \text{awayScore} \\ \\ \end{aligned} $$The result is a bivariate distribution, as described here and shown in the middle figure below:
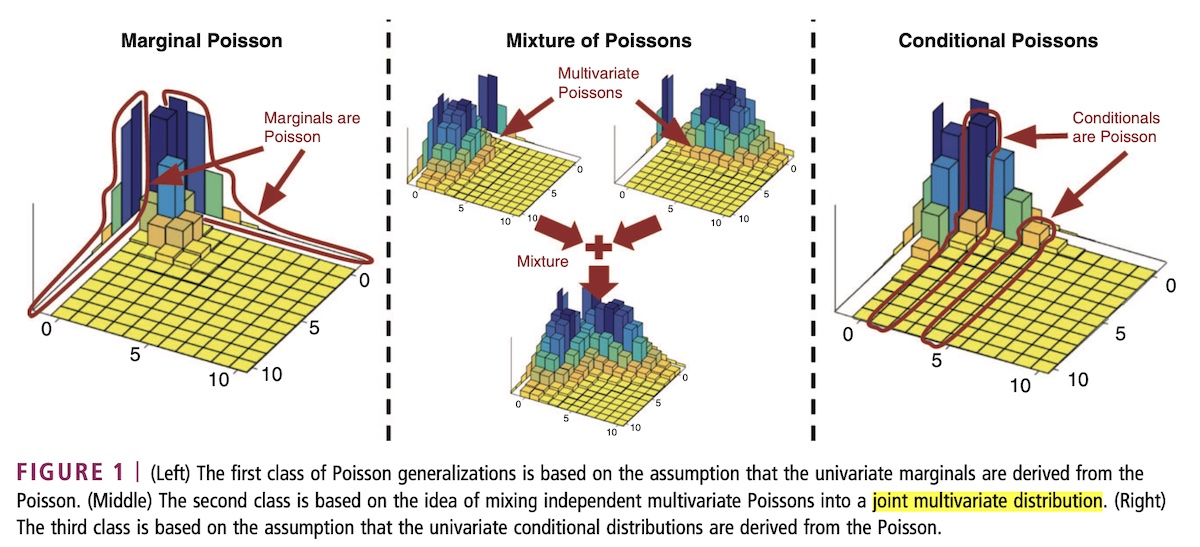
For each of the 10000 simulated games per team, we used a joint bivariate Poisson distribution to determine the probabilities of every possible outcome between 0-50 and 50-0 based on the scoring rate determined by the expected 'final' score over a 48 minute game.
$$\begin{aligned} &P(home\_win)=\sum_{i=0}^{50} \sum_{j=0}^{i-1} \frac{\lambda_h^i e^{-\lambda_h}}{i!} \cdot \frac{\lambda_a^j e^{-\lambda_a}}{j!} \\ &P(tie)=\sum_{i=0}^{50} \frac{\lambda_h^i e^{-\lambda_h}}{i!} \cdot \frac{\lambda_a^i e^{-\lambda_a}}{i!} \\ &P(home\_loss) = 1-P(home\_win)-P(tie) \\ \\ \end{aligned}$$The concept of using bivariate Poisson analysis arises from the approach that Nate Silver's FiveThirtyEight website uses for their soccer predictions: FiveThirtyEight.com -- How Our Club Soccer Predictions Work
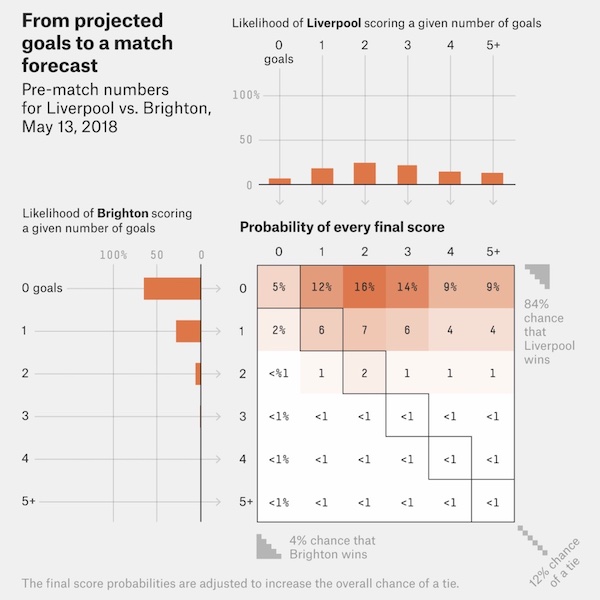
But instead of using this Poisson analysis to predict future outcomes, we've incorporated it into our Monte Carlo process to more accurately compare relative strengths of teams -- by determining the probability of winning each simulated game based on expected final score rather than counting, for instance, a simulated 10-goal victory the same "1 win" as a 1-goal victory.
For example, here's how an expected final score of 24-20 of turns out to be a 70.12% chance of victory for the home team:
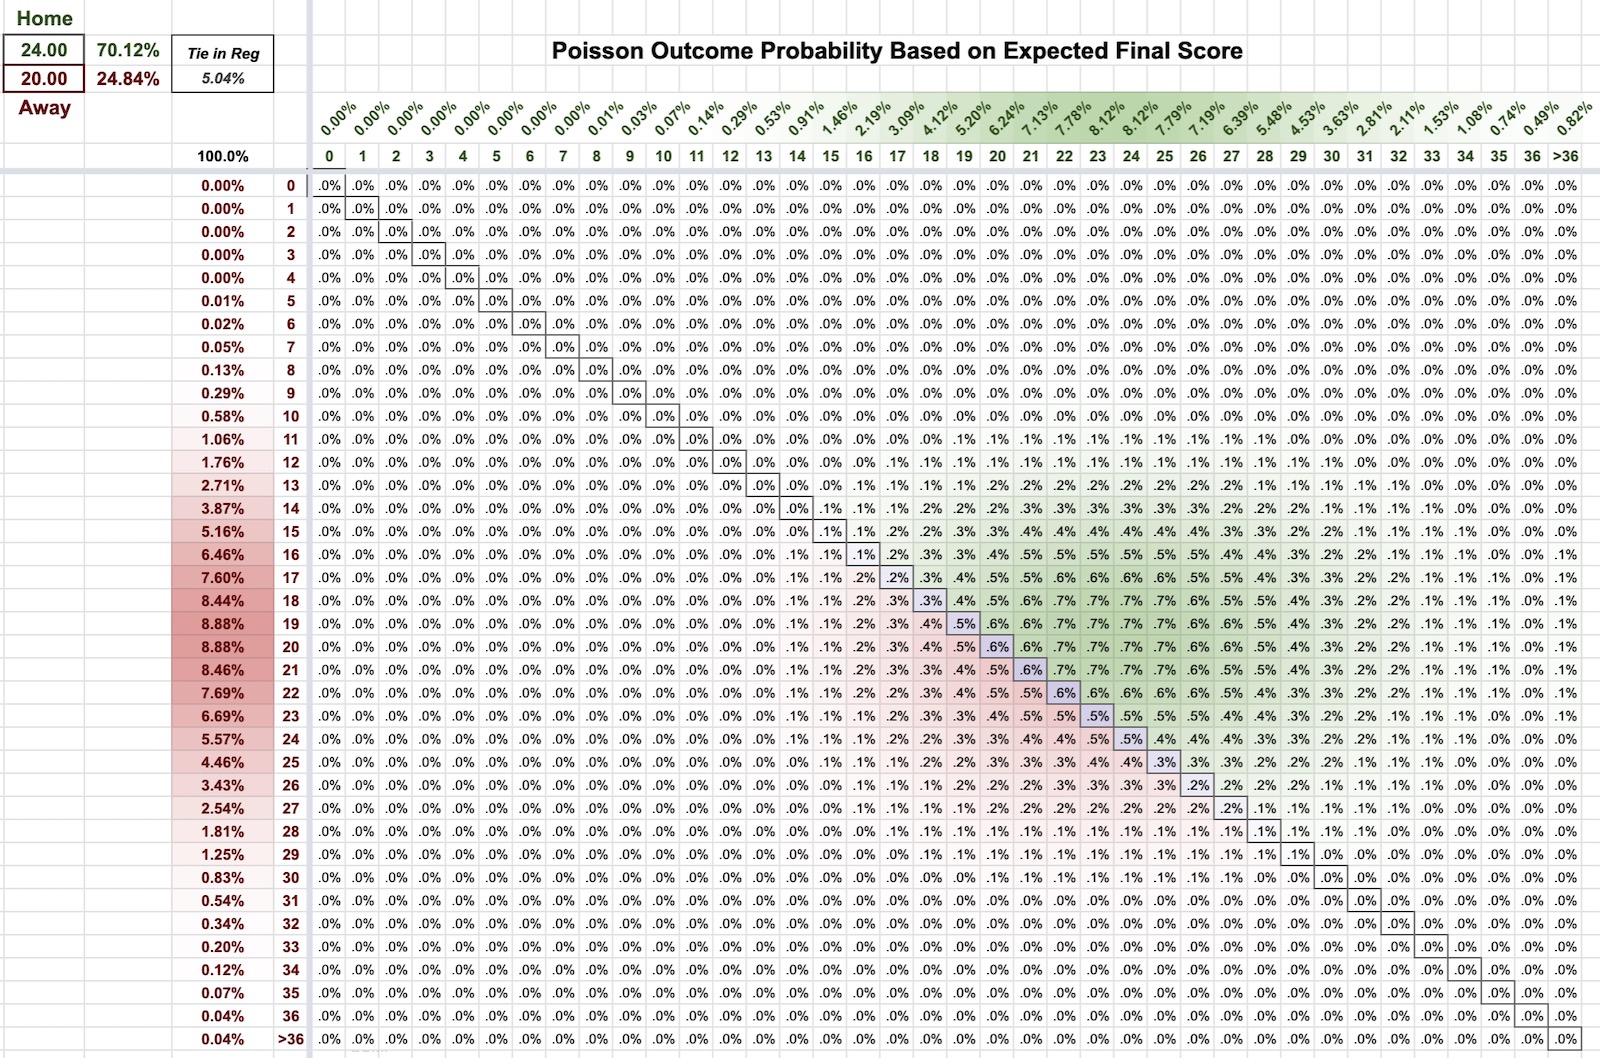
So then, we summed up $p_k = 1.0*p_{win} + 0.5*p_{tie}$ (e.g. $p_{win}=0.7012, p_{tie}=0.0504$ in the image above) for all 10000 simulated games for each team by applying the following formula to generate an unadjusted Statistical Power Index between 0 and 100...
$$SPI_{team} = 100 \cdot \frac{\sum_{k=1}^{10000} p_k}{10000}$$Now, there was only one thing left to do... consider relative strength of divisions.
Divisional Strength
Divisional strength is a typical factor in sport league team rankings, and it is particularly important for AUDL teams because the vast majority of their regular season games are within their divisions. So for instance, if a team has won 45% of its games in an extremely competitive division, it might well be historically better than a team with a 60% winning percentage in an historically weak division.
Fortunately, there have been enough cross-divisional games over the years based on the current divisional alignment to establish relative strength among the four divisions. In all, 122 games (after duplicating the postseason games) have been played between teams that are not currently in the same division. So we used these 122 cross-divisional games to run the same simulation for each division that we did for each team against "AUDL Average" home and away teams to determine the Divisional SPI scores shown here...
And there it is... 9Ware's process to generate our AUDL Historical Team Rankings!
___________________________________
Reference: Historical Records of All AUDL Teams (2012-2021)
Sorted by total games played. Six forfeits (all in 2012) were not included.